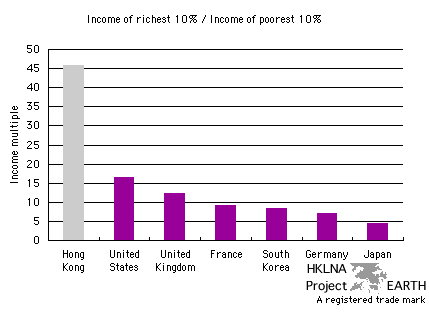
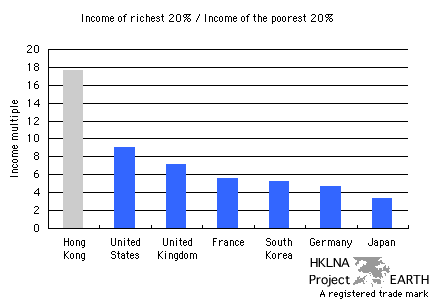
data collection index (data | graphs | tables) project index quality assessment

English or languish - Probing the ramifications
of Hong Kong's language policy

Quality Assessment
The Opportunity Cost of English Language Education

Income and Consumption inequality - An International Comparison

Exploring the Tails
Graphs 36b and 36c

Graph 36b
data collection index (graphs)
graph 34 | graphs 35a, 35b, 35c, 35d, and 35e | graphs 36a and 36c | table 34 | table 35 | table 36

Click on graph to see table
Click on bars to compare with top 10% and bottom 10%
Click Hong Kong's bar to return to international comparison of GINI indices


Graph 36b - Exploring the tails
data collection index (graphs)

The income multiple for each country or region is measured along the vertical axis.

The mulitple is found by dividing the income received by each country's or region's top 20% earners of income by the income received by each country's or region's poorest 20%.

Comparing this graph with graph 36a reveals greater disparity than that revealed by the GINI index. The comparison worsens when the top and bottom 10% income earners of each country or region are compared.

Note that income multiple for Hong Kong is approximately double that of the United States whose census data was obtained only five years earlier.


Graph 36c
data collection index (graphs)
graph 34 | graphs 35a, 35b, 35c, 35d, and 35e | graphs 36a and 36b | table 34 | table 35 | table 36

Click on graph to see table
Click on bars to compare with top 20% and bottom 20%
Click Hong Kong's bar to return to international comparison of GINI indices


Graph 36c - Exploring the tails
data collection index (graphs)

The income multiple for each country or region is measured along the vertical axis.

The mulitple is found by dividing the income received by each country's or region's top 10% earners of income by the income received by each country's or region's poorest 10%.

Comparing this graph with graph 36a reveals greater disparity than that indicated by the GINI index.

Note that the income multiple is nearly triple that of the United States whose census data was obtained only five years earlier.

   top