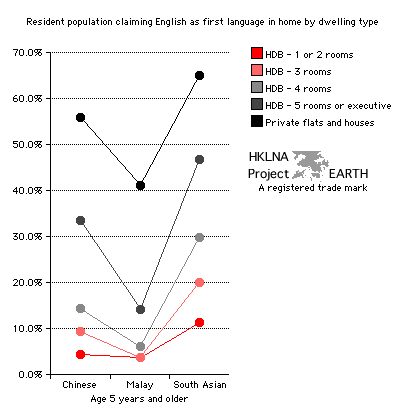
| Graph 71a - Proportion of Singapore residents
claiming English as their most frequently spoken language in the home.
By large ethnic group and dwelling type. Age 5 and over. graphs 69a and 69b | graphs 70a and 70b | graphs 71b and 71c | data collection index (graphs) |
 |
| Helpful hint: In order to
understand this graph easily select a single large ethnic group and
read vertically up and down matching the color of the dot with the type
of dwelling found in the key. Important to note are the
order in which the dots occur and the degree of separation between
them. After you have understood each ethnic group then read across
groups according to each dwelling types. For further
assistance in interpreting this graph see Hong
Kong's Neighbors
(new window) under Section Four: Language and Society, Quality
Assessment. |
| Note: As the
number of residents, households, and wage earners per
dwelling is not known, using dwelling type as a proxy for wealth and
income may or may not be appropriate. Nevertheless, given the crucial
role the English language plays in the acquisition of knowledge
and certification in Singapore's education system, the unifom pattern
of these results both within and across ethnic groups suggests a strong
correlation. |
| Data Source: Singapore Government. Department of Statistics. Singapore Census of Population 2000. Advance Data Release No.3. Literacy and Language. Table 6 - Resident population aged 5 years and over by languages most frequently spoken at home and type of dwelling 2000, p.8 [online document] Statistics Singapore/Papers and analyses/Social analysis/Advanced data release. (March 2004) [EARTH's online copy - PDF 24 KB]. Copy of data in EXCEL format also available upon special request. |
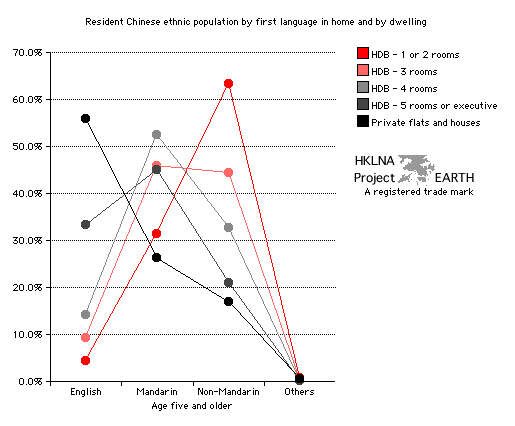
| Graph 71b - Proportion of Chinese
Singaporeans claiming English, Mandarin, a different Chinese language,
or another language as their most
frequently spoken language in the home. By
dwelling type. Age 5 and over. graphs 69a and 69b | graphs 70a and 70b | graphs 71a and 71c | collection index (graphs) |
 |
| Helpful hint: In order to understand this graph easily select a language or language group and read vertically up and down matching the color of the dot with the type of dwelling found in the key. Important to note are the order in which the dots occur and the degree of separation between them. After you have understood each language and language group then read across languages and language groups according to each dwelling types. For further assistance in interpreting this graph see Hong Kong's Neighbors (new window) under Section Four: Language and Society, Quality Assessment. |
| Data Source: Singapore Government. Department of Statistics. Singapore Census of Population 2000. Advance Data Release No.3. Literacy and Language. Table 6 - Resident population aged 5 years and over by languages most frequently spoken at home and type of dwelling 2000, p.8. [online document] Statistics Singapore/Papers and analyses/Social analysis/Advanced data release. (March 2004) [EARTH's online copy - PDF 24 KB]. Copy of data in EXCEL format also available upon special request. |
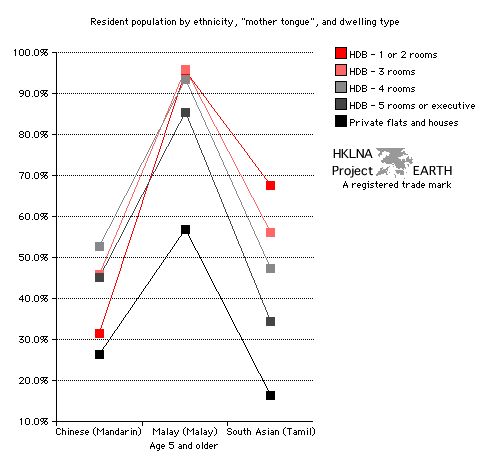
| Graph 71c - Proportion of Singapore
residents claiming an official mother tongue as their most
frequently spoken language in the home. By corresponding large ethnic
group and
dwelling type. Age 5 and over. graphs 69a and 69b | graphs 70a and 70b | graphs 71a and 71b | collection index (graphs) |
 |
| Helpful hint: In order to understand this graph easily select an ethnic group and corresponding mother tongue. (See notes provided under graphs 69a and 69b for brief discussions explaining the meaning of mother tongues)Then read vertically up and down matching the color of the dot with the type of dwelling found in the key. Important to note are the order in which the dots occur and the degree of separation between them. After you have understood each ethnic group and corresponding language read across groups and languages while tracing a single dwelling type. For further assistance in interpreting this graph -- especially the notion of mother tongue -- see Hong Kong's Neighbors (new window) under Section Four: Language and Society, Quality Assessment. |
| Data Source: Singapore Government. Department of Statistics. Singapore Census of Population 2000. Advance Data Release No.3. Literacy and Language. Table 6 - Resident population aged 5 years and over by languages most frequently spoken at home and type of dwelling 2000, p.8. [online document] Statistics Singapore/Papers and analyses/Social analysis/Advanced data release. (March 2004) [EARTH's online copy - PDF 24 KB]. Copy of data in EXCEL format also available upon special request. |
| top |