|
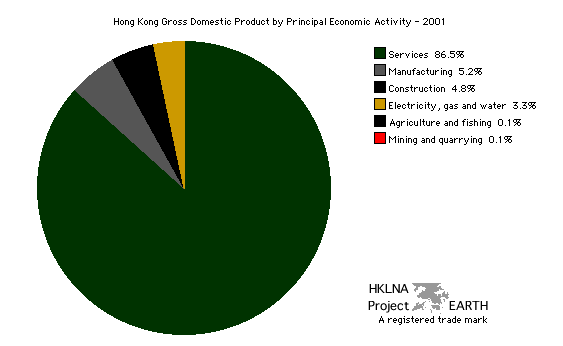
Graph 42a - Gross domestic product by principal economic activity 2001 |
 |
| Source data: Hong Kong Census and Statistics Department. Hong Kong in Figures. National Income and Balance of Payments. GDP by economic activity. 1997 - 2002 [online document] |
| top |
|
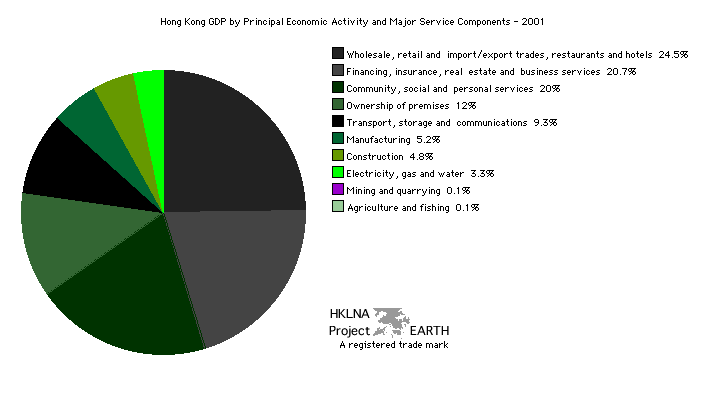
Graph 42b - Gross domestic product by principal economic activity and major service component 2001 |
 |
| Source data: Hong Kong Census and Statistics Department. Hong Kong in Figures. National Income and Balance of Payments. GDP by economic activity. 1997 - 2002 [online document] |
| top |
|
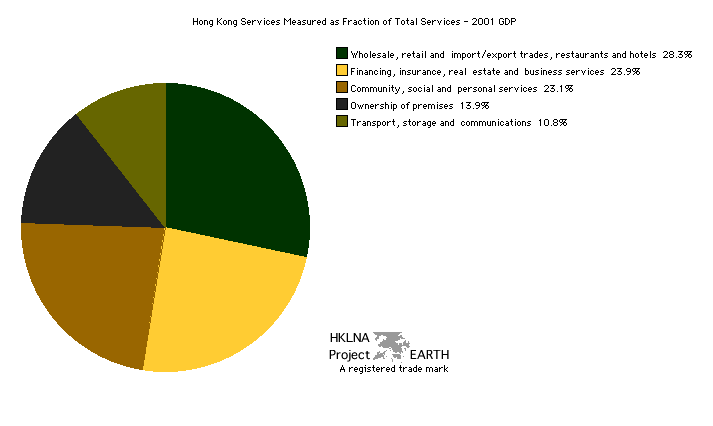
Graph 42c - Hong Kong's principal service components measured as fraction of total services 2001 |
 |
| Source data: Hong Kong Census and Statistics Department. Hong Kong in Figures. National Income and Balance of Payments. GDP by economic activity. 1997 - 2002 [online document] |
| top |