| Graph 61a - Primary School Leaving
Examination Candidates by Ethnicity and so-called Mother Tongue
in 2001. graph 51a | graph 51b | graph 59a | graph 59b | graph 60 | graph 61b | collection index (graphs) |
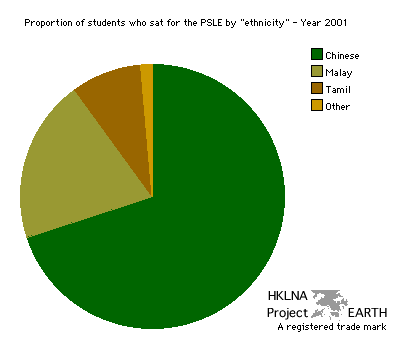 |
| Note: When referring to
Singapore's official languages (so-called
mother tongues) the MOE distinguishes among speakers of English,
Chinese, Malay, and Tamil. When referring to ethnicity the words
Tamil and English are replaced with Indian and Other, respectively. Is
it not likely that ethnic classification in Singapore is conducted, as
it is
conducted in many places of the world? The government divides its citizenry into abstract ethnic groups based on a small number of religious, racial, linguistic, social, geographical, and/or historical traits. Its citizenry are then provided with various government forms on which the names of these abstract groups are listed. Each time a citizen fills out a form, he is asked to select that one name with which he can best identify; this becomes his or her group identity. Having gotten everyone to join an abstract group the government then seeks through various policy measures to develop each into a living reality. |
| Data Source: Singapore Government.
Ministry of Education. Planning Division. Management Information
Branch. Education Statistics DigestOnline. Enrolment, intake, and
output. Examination Output by Level, Indicators, Ethnic Group, Year.
Table 31 - Percentage of pupils eligible for secondary school. [online
document] (March 2004). Also available on page 52 in the ministry's
report
entitled Education Statistics Digest 2002. Moulding the future of our
nation. [EARTH's online
copy - PDF 6.8 MB]. Copy of data in EXCEL format also available
upon special request. |
| Graph 61b - PSLE candidates eligible for
entry into secondary school. graph 51a | graph 51b | graph 59a | graph 59b | graph 60 | graph 61a | collection index (graphs) |
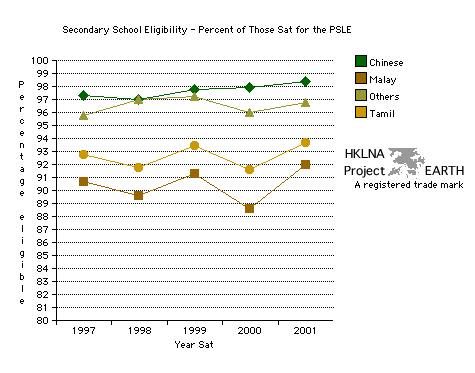 |
| Note: See note to graph 61a above. |
| Data Source: Singapore Government. Ministry of Education. Planning Division. Management Information Branch. Education Statistics DigestOnline. Enrolment, intake, and output. Examination Output by Level, Indicators, Ethnic Group, Year. Table 31 - Percentage of pupils eligible for secondary school. [online document] (March 2004). Also available on page 52 in the ministry's report entitled Education Statistics Digest 2002. Moulding the future of our nation. [EARTH's online copy - PDF 6.8 MB]. Copy of data in EXCEL format also available upon special request. |
| top |