| Graph 51a - Singapore's linguistic diversity. graph 24 | graph 51b | graph 52a | graph 55 | graph 56 graphs 61a and 61b | graph 72 | graph 74b | graph 75b | data collection index (graphs) |
 |
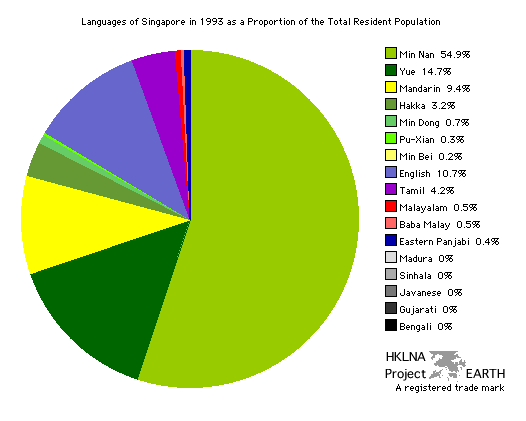
| Note: The areas shaded in green
and yellow including Min Nan, Yue, Mandarin, Hakka, Min Dong, Pu-Xian,
and Min Bei represent different languages spoken in both China and
Singapore. Together these seven languages constitute 83.5% of all
mother tongue speakers in Singapore. They are commonly and mistakenly
lumped together as a single language -- namely Chinese. In
reality they are different languages spoken by Chinese immigrants and
their descendants from different parts of China. Singapore and China differ in their emphasis on the English and Mandarin languages. Whereas English is the first second language of Singapore, Mandarin is the first second language in China. Although everyone is reuired to study English in Singapore, choosing among Malay, Tamil, and Mandarin is optional. Just as Mandarin is learned as a second language by a very large proportion of Chinese living in China, so too is it learned as a second language by most Chinese Singaporeans. |
| Source: Ethnologue. Languages of
Singapore [online document] (06 March 2004). Table provided on request. |
| Graph 51b - Singapore's ethnic diversity graph 11 | graph 12 | graph 24 | graph 51a | graph 52a | graph 61a | graph 61b | graph 72 | data collection index (graphs) |
 |
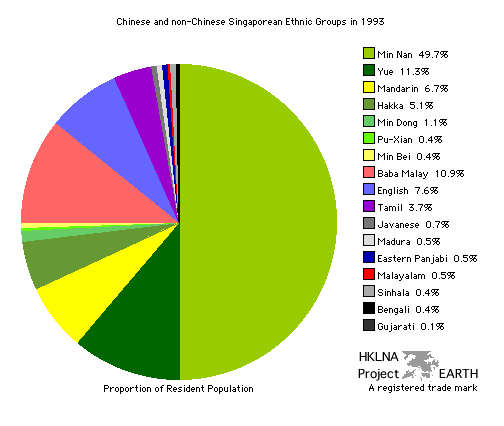
| Note 1: The areas shaded in green
and yellow represent different Chinese ethnic groups. Each ethnic
groups stems from a different part of China. Linguistically speaking
some ethnic groups are closer to others. Where some are only separated
by dialectical differences others are separated by completely different
languages. |
| Note 2: One's racial and cultural
background and one's mother tongue are not always the same. Comparing
graphs 51a and 51b demonstrate how ethnicity
and mother tongue can differ according to one's household, community,
and region. Obviously there are more speakers who claim a Chinese
language as their mother tongue than claim Chinese ethnicity. Those
claiming Chinese ethnicity amounted to 74.8% of the
total population. |
| Source: Ethnologue. Languages of
Singapore [online document] (06 March 2004). Table provided on request. |
| top |