Section four
Language and Society
Hong Kong's Neighbors
Greenberg's Diversity Index
Line and Pie Graphs Generated from Artificially Created Data
| Graph 75a - Greenberg's diversity index for
two and more languages distributed equally across ten hypothetical
populaions. graph 27 graph 56 graph 74a and 74b graph 75b graph table 27b collection index (graphs) |
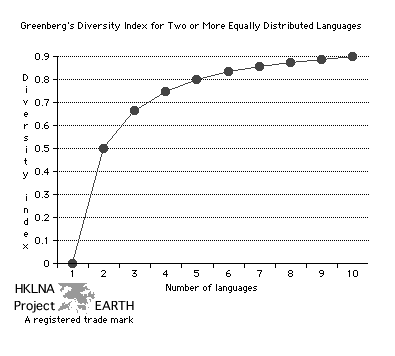 |
| Note1:
This
is a graph of artificially generated data obtained by substituting
values of Pi
into the
formula for calculating Greenberg's diversity index. Each
value of Pi substituted
corresponded to the relationship Pi
= 1/n, where n equal the total number of languages. |
|
| Note 2:
After 5 languages divided equally among a given population most of the
diversity indicated by Greenberg's diversity index has been accounted
for. |
|
| Source: Greenberg, Joseph H. 1956. The measurement of linguistic diversity. Language, vol. 32, 1, March. | |
| Graph 75b - Pie graphs corresponding
to populations with two or more languages represented in equal
proportions. graph 27 | graph 51a | graph 52a | graph 55 | graph 56 | graphs 74a and 74b | graph 75a | table 27b | collection index (graphs) |
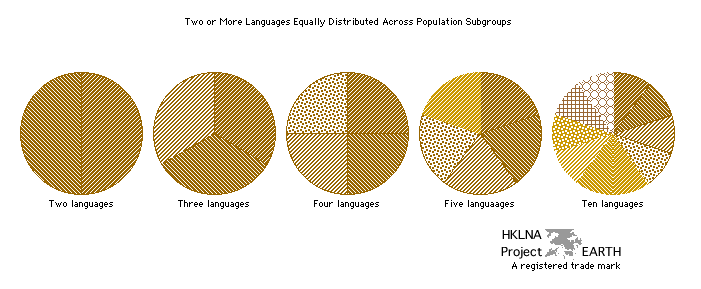 |
| Note: These pie graphs correspond
to the data illustrated in graph 75a
above. The pie graphs for populations with six, seven, eight, and
nine languages are not provided. Each language is represented equally
in each of the populations shown. |
| Source: See source and note entries for graph 75a above. |
| top |