| Graph 67a - Public School Output by Level of
Education. graphs 59a and 59b | graph 60 | graphs 63a and 63b | graph 64 | graph 65 | graph 67b | collection index (graphs) |
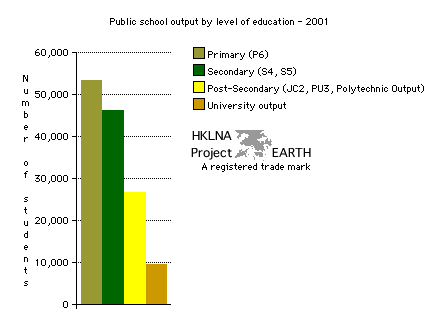 |
| Note 1: In order to obtain
an
accurate picture of the rate by which students are filtered out of
Singapore's educational system only students enrolled in their final
year of primary and secondary school and graduates of post-secondary,
and pre-university post-secondary schools, and universities are shown. Note 2: As the report was published in September 2002, one must assume that the figures reported are for the academic year 2001-2002. |
| Data Source: Singapore Government. Ministry of Education. Planning Division. Management Information Branch. Education Statistics Digest 2002. Moulding the future of our nation. Table 4 - Enrolment, Number of classes, and class size, p. 7. Table 14 Intake, enrolment and output of ITE in 2001 (full-time), p. 22. Table 15 - Intake, enrolment and graduates of polytechnics in 2001 (full-time), p. 23. Table 16 - Intake, enrolment and graduates of universities in 2001 (full-time), p. 24. [EARTH's online copy - PDF 6.8 MB]. Copy of data in EXCEL format also available upon special request. |
| Graph 67b - Public and Private School
Enrolment by Type of School. graphs 59a and 59b | graph 60 | graphs 63a and 63b | graph 64 | graph 65 | graph 67a | graphs 68a and 68b | collection index (graphs) |
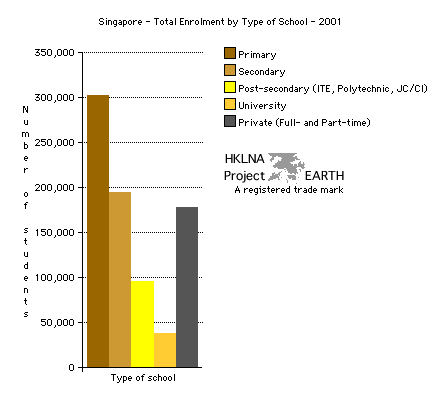 |
| Note 1: Under the
assumptions
that everyone who attends primary and secondary school attends
full-time this graph compares full-time public education with
full- and part-time private education enrolment. Unlike graph 67a this graph also shows approximately how
all students are distributed throughout the public education system --
not just those standing at the exits of each major educational level. Note 2: As the report was published in September 2002, one must assume that the figures reported are for the academic year 2001-2002. |
| Data Source: Singapore Government. Ministry of Education. Planning Division. Management Information Branch. Education Statistics Digest 2002. Moulding the future of our nation. Table 5 - Primary enrolment by age, p. 9. Table 6 - Secondary enrolment by age, p. 11. Table 7 - Pre-university enrolment by age, p. 13. Table 13 - Statistics on private educational institutions, p. 20. Table 14 - Intake, enrolment and output of ITE in 2001 (Full-time), p. 22. Table 15 - Intake, enrolement, and graduates of polytechnics in 2001 (Full-time), p. 23. Table 16 Intake, enrolment and graduates of universities in 2001 (Full-time), p. 24. [EARTH's online copy - PDF 6.8 MB]. Copy of data in EXCEL format also available upon special request. |
| top |