Hong Kong's Information Society
The structure, flow, use, and language of information in Hong Kong society
Hong Kong's Information Technology and Telecommunications Industries
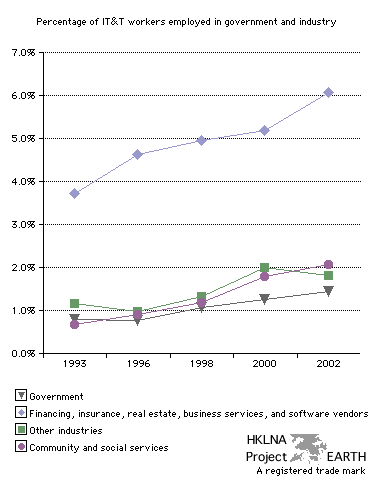
| Graph 108a - Percentage of IT&T
workers employed in government and various industries. graphs 101a, 101b, and 101c | graphs 108b and 108c | graph 109 | graphs 114a and 114b | data collection (graphs) |
 |
| Note 1: As the data for the distribution of IT&T across industries in the report entitled Hong Kong as an Information Society (see source 3 below) is organized in the same manner that the distribution of workers is organized for Hong Kong's work force in general (see source 1 below), obtaining these figures was a simple matter of aggregation and division. |
| Note 2: A careful review of the data showed that the category labelled financing, insurance, real estate, business services, and software vendors was a clear and obvious outlier. It is for this reason that it was listed separately. An obvious explanation for its being an outlier is, of course, that a large portion of Hong Kong's IT&T work force are included under the category software vendors (see the category IT distribution in graph 101a). |
| Note 3: In general IT&T
workers make up for about one to two percent of Hong Kong's government
and industrial work force. Although both government and industry appear
to show steady positive growth in the number of IT&T workers they
employ, the Hong Kong government appears to be lagging behind other
employment sectors in the employment of IT&T workers. |
| Source 1: Hong Kong Government. Census and Statistics Department. Hong Kong statistics. Frequently asked statistics. Labour and employment. Number of establishments, persons engaged and vacancies (other than those in the civil service) analysed by industry sector [online document] (18 June 2004). EARTH's copy of corresponding table available on request. |
| Source 2: Hong Kong Government. Census and Statistics Department. Hong Kong Statistics. Frequently Asked Statistics. Labour and employment. Number of civil servants and civil service vacancies [online document] (18 June 2004). EARTH's copy of corresponding table available on request. |
| Source 3: Hong Kong Government. Census and Statistics Department. Information Technology and Telecommunications Statistics Section. 2003. Hong Kong as an Information Society. Chapter 7 - Human Resources in Information Technology. Table 7.1 - Manpower structure of the information technology (IT) sector by nature of job, p. 103. Table 7.2 - Distribution of information technology (IT) employees by sector, P. 105. EARTH's copy of corresponding table available on request. |
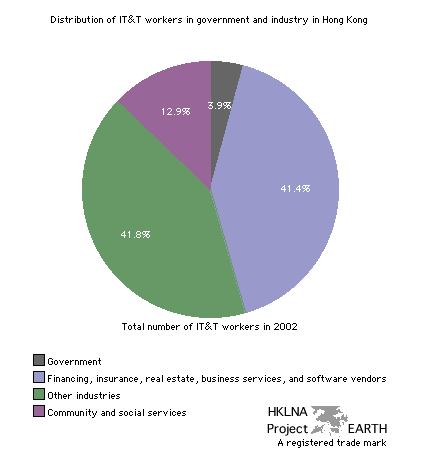
| Graph 108b - Distribution of IT&T
workers in Hong Kong government and industry in 2002. graphs 101a, 101b, and 101c | graphs 108a and 108c | graph 109 | graphs 114a and 114b | data collection (graphs) |
 |
| Note: This graph and its complement below reflect how workers, both IT&T workers (this graph) and workers in general (graph 108c), are distributed across Hong Kong government and industry. See note 1, graph 108a for further clarification. |
| Source: Hong Kong Government. Census and Statistics Department. Information Technology and Telecommunications Statistics Section. 2003. Hong Kong as an Information Society. Chapter 7 - Human Resources in Information Technology. Table 7.1 - Manpower structure of the information technology (IT) sector by nature of job, p. 103. Table 7.2 - Distribution of information technology (IT) employees by sector, P. 105. EARTH's copy of corresponding table available on request. |
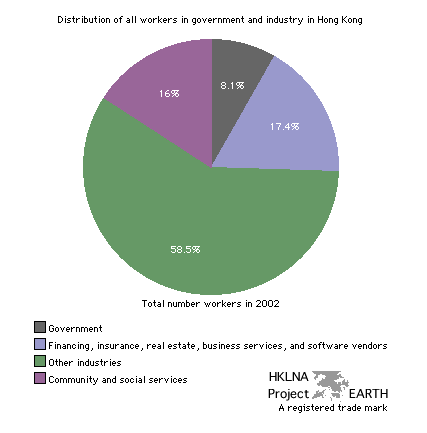
| Graph 108c - Distribution of all
workers in Hong Kong government and industry in 2002. graphs 101a, 101b, and 101c | graphs 108a and 108b | graph 109 | graphs 114a and 114b | data collection (graphs) |
 |
| Note: This graph and its complement below reflect how workers, both IT&T workers (this graph) and workers in general (graph 108b), are distributed across Hong Kong government and industry. See note 1, graph 108a for further clarification. |
| Note 2: The categories community and social services and financing, insurance, real estate, business services, and software vendors are separate industrial headings under the more general category industry. The category other industries is an aggregate of all remaining industries included under the more general heading. Although it is clear how the general heading industry is divided, exactly what it contains and why it is so constituted is not at all clear. Please see graph 109 and the accompanying notes in order to obtain a grasp for what is missing. |
| Source: Hong Kong Government. Census and Statistics Department. Information Technology and Telecommunications Statistics Section. 2003. Hong Kong as an Information Society. Chapter 7 - Human Resources in Information Technology. Table 7.1 - Manpower structure of the information technology (IT) sector by nature of job, p. 103. Table 7.2 - Distribution of information technology (IT) employees by sector, P. 105. EARTH's copy of corresponding table available on request. |
| top |