Hong Kong's Information Society
The structure, flow, use, and language of information in Hong Kong society
Hong Kong's Information Technology and Telecommunications Industries
| Graph 101a - Distribution of labor
across Hong Kong's major IT&T industries in 2002. graph 98 | graph 99 | graph 100 | graphs 101b and 101c | graphs 102a and 102b | graph 103 | graph 108a, 108b, and 108c | graph 109 | data collection (graphs) |
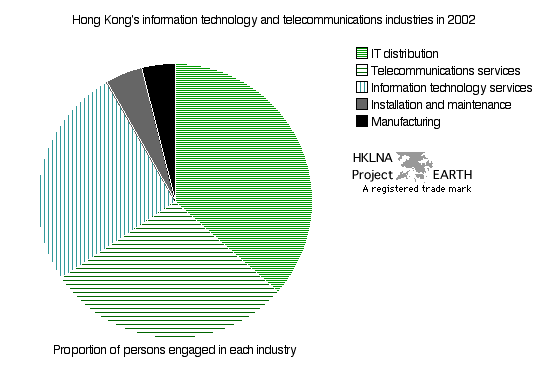 |
| Note 1: The data for the above
graph were obtained by summing the total number of people employed in
each IT&T industry and then dividing that total into the number of
workers employed in each IT&T industry. |
| Note 2: One must assume from the data provided that people found in each of these industries are scattered throughout the Hong Kong economy. In brief, an IT&T maintenance worker is someone employed in another indusry, say the textile, financial, or transportation industry, as IT&T staff. In other words, it would be double counting to add IT&T's contribution to Hong Kong's GDP as if it were just another industry. Although a separate category of economic activity, IT&T industrial production is an activity largely drawn from activity already measured by other means. |
| Source: Hong Kong Government. Census and Statistics Department. Information Technology and Telecommunications Statistics Section. 2003. Obtained on special request. EARTH's copy of corresponding table available as .xls or .pdf document on request |
| Graph 101b - Average monthly wage paid
to IT&T workers by IT&T industry in 2002. graph 98 | graph 99 | graph 100 | graphs 101a and 101c | graphs 102a and 102b | graph 103 | graph 108a, 108b, and 108c | graph 109 | data collection (graphs) |
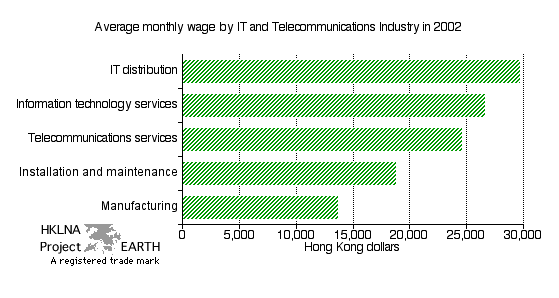 |
| Note 1: These data were obtained
by dividing total wage payments to workers of each IT&T industry
(see graph 101c below) by the
number of workers employed in each IT&T industry. The term workers is used here to include both
managerment and labor -- namely, all employees employed in a particular
IT&T industry. |
| Source: Hong Kong Government. Census and Statistics Department. Information Technology and Telecommunications Statistics Section. 2003. Obtained on special request. EARTH's copy of corresponding table available as .xls or .pdf document on request |
| Graph 101c - IT&T total wage and
salary payments by industry in 2002. graph 98 | graph 99 | graph 100 | graphs 101a and 101b | graph 102a and 102b | graph 103 | graph 108a, 108b, and 108c | graph 109 | data collection (graphs) |
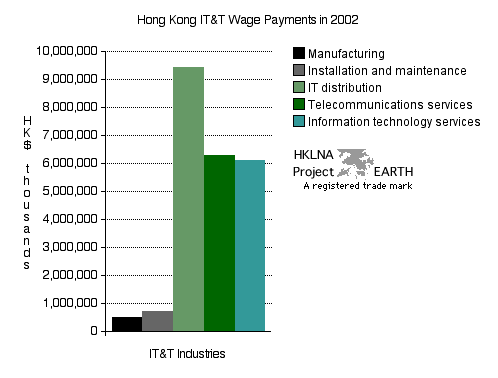 |
| Note 1: These
data are assumed to include wage and salary payments made to all
workers employed in
each IT&T industry in 2002 -- in effect the annual factor
cost components attributed to workers, both management and labor, of
each IT&T industry. |
| Source: Hong Kong Government. Census and Statistics Department. Information Technology and Telecommunications Statistics Section. 2003. Obtained on special request. EARTH's copy of corresponding table available as .xls or .pdf document on request |
| top |