Hong Kong's Information Society
The structure, flow, use, and language of information in Hong Kong society
Household computers and internet access in Hong Kong
Closing the household computer and internet access gaps in 2003
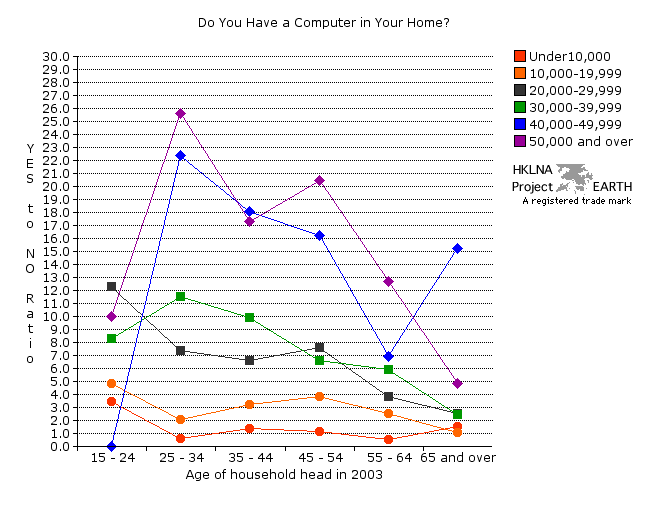
| Graph 96a - Yes/No Ratio in answer to
the question, "Do you have a computer in your home?" graphs 87a, 87b, and 87c | graphs 88a and 88b | graphs 89a and 89b | graphs 90a, 90b, and 90c | graphs 91a and 91b | graphs 92a and 92b | graph 93b | graphs 94a, 94b, 94c, and 94d | graphs 95a and 95b | graph 96b | data collection (graphs) |
 |
| Note 1:
The Yes/No ratio is useful, because it tells us about the relative
presence and absence of a given entity within a specific population
cohort. By way of example, consider the group of Hong Kongers age 25 to
34 with monthly earnings equal to or in excess of HK50,000. For about
every 26 of these households, there is only one in the same group
without a computer. In contrast, in Hong Kong households with monthly
earnings under HK$10,000, whose household heads are between the ages of
25 and 34, and 55 and 64, there are more households without a computer
than there are those with. (Note 1, table 96b) |
| Note 2:
Comparing the number of households with and without a computer for each
income level and age group reveals three distinct patterns: low
income (red and orange), middle income (green and black),
and high income (blue and purple). Higher income groups
demonstrate higher Yes/No ratios than do lower income groups. The zero
rating for those households with monthly earnings equal to HK$40,000 to
HK$49,999 and household heads aged 15 to 24 is misleading, as there
were no data available for this category. The general decline in the
ratio of households with and without a computer as one moves from
households with younger to older heads can be better explained by the
age of computer technology than the age of the household head. Older
Hong Kong residents are simply a technological generation or more
behind. The vary high Yes /No ratio for the group with monthly earnings
between HK$40,000 and HK$49,999 and household heads between the ages of
65 and over is probably due to sampling or measurement error. (Note 2, table 96b) |
| Note 3: "Personal computers refers to a computer designed for individual use. Personal computers includes desktop computer, laptop/notebook computer and Personal Digital Assistant. Servers, workstations and terminals of mainframe or minicomputer are not included. Personal computers may be connected to form a Local Area Network (LAN) or Wide Area Network (WAN)." Source: Hong Kong Government. Census and Statistics Department. Information Technology and Telecommunications Statistics Section. 2003. Hong Kong as an Information Society. Appendix A - Terms and Definitions 1.3, p. 115. Comment: An email from the Social Survey Section of CSD confirmed that both sections used the same definition for the term personal computer in their respective reports. |
| Source: Hong Kong Government. Census and Statistics Department. Social Surveys Section. 2003. Thematic Household Survey. Information Technology Usage and Penetration. Data obtained by special request from the Social Surveys Section. EARTH's copy of the corresponding table is available on request. |
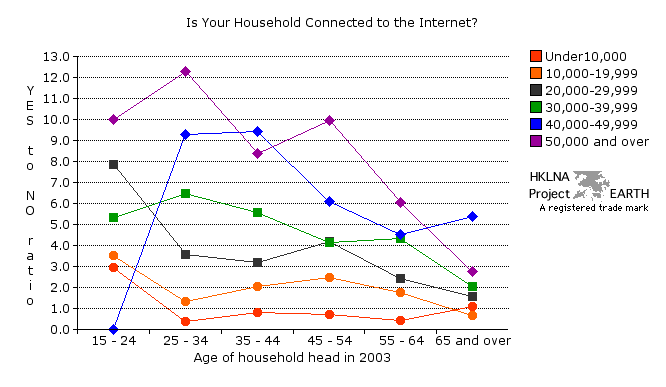
| Graph 96b - Yes/No Ratio in
answer to the question, "Is your household connected to the internet?". graphs 87a, 87b, and 87c | graphs 88a and 88b | graphs 89a and 89b | graphs 90a, 90b, and 90c | graphs 91a and 91b | graphs 92a and 92b | graph 93a | graphs 94a, 94b, 94c, and 94d | graphs 95a and 95b | graph 96a | data collection (graphs) |
 |
| Note 1:
See note 1 table 96a for explanation of
Yes/No ratio. |
| Note 2:
The three distinct income groups observed in graph 96a above become
muddled with respect to households connected to the internet. In
addition there is a dramatic shift in the range of values over which
the Yes/No ratio spans. In graph 96a we noted a 26 to 1 ratio for
households with monthly earning HK$50,000 or above and household heads
between the ages of 25 and 34. In graph 96b this ratio drops to about
13 to 1. Obviously there is more than montly income involved when it
comes to connecting to the internet from one's home. The same
aberrations observed in graph 96a for the HK$40,000 to HK$49,999 income
group also occur in graphs 96b. Once again, there is a general decline
in connectivity associated with age. See note 2,
table 96a. |
| Note 3: "Internet is the world-wide public computer network, which provides access to a wide range of services including the world wide web, email, newsgroup and file transfer." Source: Hong Kong Government. Census and Statistics Department. Information Technology and Telecommunications Statistics Section. 2003. Hong Kong as an Information Society. Appendix A - Terms and Definitions 2.11, p. 117. |
| Source: Hong Kong Government. Census and Statistics Department. Social Surveys Section. 2003. Thematic Household Survey. Information Technology Usage and Penetration. Data obtained by special request from the Social Surveys Section. EARTH's copy of the corresponding table is available on request. |
| top |